How to Cite
Copyright notice
Authors who publish with this journal agree to the following terms:
Authors retain copyright and grant the journal right of first publication, with the work twelve (12) months after publication simultaneously licensed under a Creative Commons Attribution License that allows others to share the work with an acknowledgement of the work’s authorship and initial publication in this journal.
- After 12 months from the date of publication, authors are able to enter into separate, additional contractual arrangements for the non-exclusive distribution of the journal's published version of the work (e.g., post it to an institutional repository or publish it in a book), with an acknowledgement of its initial publication in this journal.
Keywords
Abstract
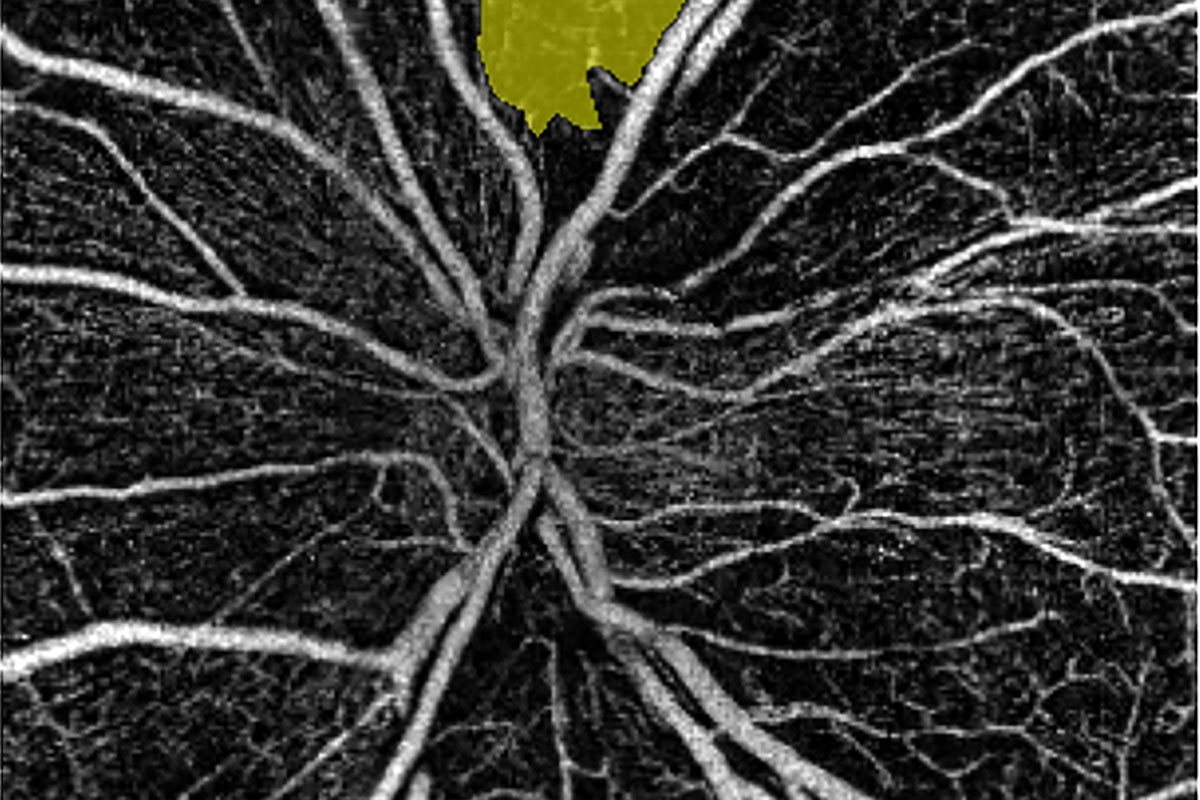
Purpose: To investigate the applicability of peripapillary non-flow area (PNFA) measurement in the radial peripapillary capillaries (RPC) layer for the measurement of progressive localized glaucomatous perfusion damage.
Methods: A research soft ware version of the Angiovue /RTVue-XR OCT (Optovue, Fremont, CA, USA) was used to measure localized PNFA progression by clicking on a predefined peripapillary non-perfusion area on prospectively acquired images. Capillary vessel density (VD) in the corresponding peripapillary sector was also measured. High-quality peripapillary Angiovue OCT VD images of an open-angle glaucoma population prospectively imaged for 2 to 2.5 years (5 or 6 visits at 6-month intervals) were investigated. Eyes with both localized PNFA at baseline and statistically significant peripapillary VD progression in the hemifield of the PNFA were selected for the analysis.
Results: Four eyes of four patients were eligible. In three eyes, the Octopus visual field cluster mean defect in the cluster spatially corresponding to the area of the PNFA progressed significantly (P < 0.01) at a rate of 1.5 to 3.4 dB/year. In two eyes, neither PNFA nor sector VD showed significant correlation with the follow-up time. In one eye, significant negative correlation for sector VD (r = -0.841, P = 0.036) and almost significant positive correlation for PNFA (r = 0.803, P = 0.055) was found, while in another eye significant positive correlation for PFNA (r = 0.875, P = 0.022) but no correlation for sector VD was found.
Conclusion: Our results suggest that PNFA measurement in the RPC layer is a potentially useful tool for the measurement of progression of localized glaucomatous capillary perfusion damage in open-angle glaucoma eyes with localized peripapillary non-perfusion.
References
Wang W, He M, Li Z, et al. Epidemiological variations and trends in health burden of glaucoma worldwide. Acta Ophthalmol. 2019;97:e349-e355. doi:10.1111/aos.14044
European Glaucoma Society. Terminology and guidelines for glaucoma 4th Edition. Publicom, Savona 2014.
Pinto AL, Willekens K, Van Keer K, et al. Ocular blood flow in glaucoma - the Leuven Eye Study. Acta Ophthalmol. 2016;94:592-598. doi:10.1111/aos.12962
Flammer J, Orgül S, Costa VP, et al. The impact of ocular blood flow in glaucoma. Prog Retin Eye Res. 2002;21:359-93
Grudzinska E, Modrzejewska M. Modern diagnostic techniques for the assessment of ocular blood flow in myopia: current state of knowledge. J Ophthalmology. 2018;4694789. doi:10.1155/2018/4694789
Yarmohammadi A, Zangwill LM, Diniz-Filho A, et al. Optical coherence tomography angiography vessel density in healthy, glaucoma suspect, and glaucoma eyes. Invest Ophthalmol Vis Sci. 2016;57:OCT451-459. doi:10.1016/j.ophtha.2017.01.004
Liu L, Jia Y, Takusagawa HL, et al. Optical coherence tomography angiography of the peripapillary retina in glaucoma. JAMA Ophthalmol. 2015;133:1045-1052 doi:10.1001/jamaophthalmol.2015.2225
Yarmohammadi A, Zangwill LM, Diniz-Filho A, et al. Relationship between optical coherence tomography vessel density and severity of visual field loss in glaucoma. Ophthalmology. 2016;123:2498-2508. doi:10.1016/j.ophtha.2016.08.041
Holló G. Relationship between optical coherence tomography sector peripapillary angioflow-density and Octopus visual field cluster mean defect values. PLoS One. 2017;12:e0171541. doi:10.1371/journal.pone.0171541
Geyman LS, Garg RA, Suwan Y, et al. Peripapillary perfused capillary density in primary open-angle glaucoma across disease stage: an optical coherence tomography angiography study. Br J Ophthalmol. 2017;101:1261-1268. doi:10.1136/bjophthalmol-2016-309642
Shoji T, Zangwill LM, Akagi T, et al. Progressive macula vessel density loss in primary open-angle glaucoma: A longitudinal study. Am J Ophthalmol. 2017;182:107-117. doi: 10.1016/j.ajo.2017.07.011
Holló G. Comparison of peripapillary OCT angiography vessel density and retinal nerve fiber layer thickness measurements for their ability to detect progression in glaucoma. J Glaucoma. 2018;27:302-305. doi:10.1097/IJG.0000000000000868
Holló G. Influence of removing the large retinal vessels-related effect on peripapillary vessel density progression analysis in glaucoma. J Glaucoma. 2018;27:e137-e139. doi:10.1097/IJG.0000000000000990
Holló G. Progressive decrease of peripapillary angioflow vessel density during structural and visual field progression in early primary open-angle glaucoma. J Glaucoma. 2017;26:661-664. doi:10.1097/IJG.0000000000000695
Holló G. Valsalva maneuver and peripapillary OCT angiography vessel density. J Glaucoma. 2018;27:e133–e136. doi:10.1097/IJG.0000000000000983
Holló G. Influence of large intraocular pressure reduction on peripapillary OCT vessel density in ocular hypertensive and glaucoma eyes. J Glaucoma. 2017;26:e7-e10. doi:10.1097/IJG.0000000000000527
Holló G. Influence of posterior subcapsular cataract on structural OCT and OCT angiography vessel density measurements in the peripapillary retina. J Glaucoma. 2019; 28.e61-e63. doi:10.1097/IJG.0000000000001147
Holló G. Peripapillary capillary vessel density progression in advanced glaucoma: a case report. BMC Ophthalmol 2019;19:2 https://doi.org/10.1186/s12886-018-1021-x
Optovue Inc. RTVue XR Avanti System. User Manual International Software Version 2017.1. Release date: 11/2017.
Garway-Heath DF, Poinoosawmy D, Fitzke FW, Hitchings RA. Mapping the visual field to the optic disc in normal tension glaucoma eyes. Ophthalmology 2000;107:1809-1815.
Atta Allah HR, Mohamed AAM, Ali MA. Macular vessels density in diabetic retinopathy: quantitative assessment using optical coherence tomography angiography. Int Ophthalmol. 2018;Sep 7. doi:10.1007/s10792-018-1013-0. [Epub ahead of print]
Holló G. Comparison of structure-function relationship between corresponding retinal nerve fibre layer thickness and Octopus visual field cluster defect values determined by normal and tendency-oriented strategies. Br J Ophthalmol 2017;101:150-154. doi:10.1136/bjophthalmol-2015-307759
Racette L, Fischer M, Bebie H, et al. Visual field digest: A guide to perimetry and the Octopus perimeter. 7th edition, Hag-Streit AG, Köniz, 2017:165-187.